Change Symbol
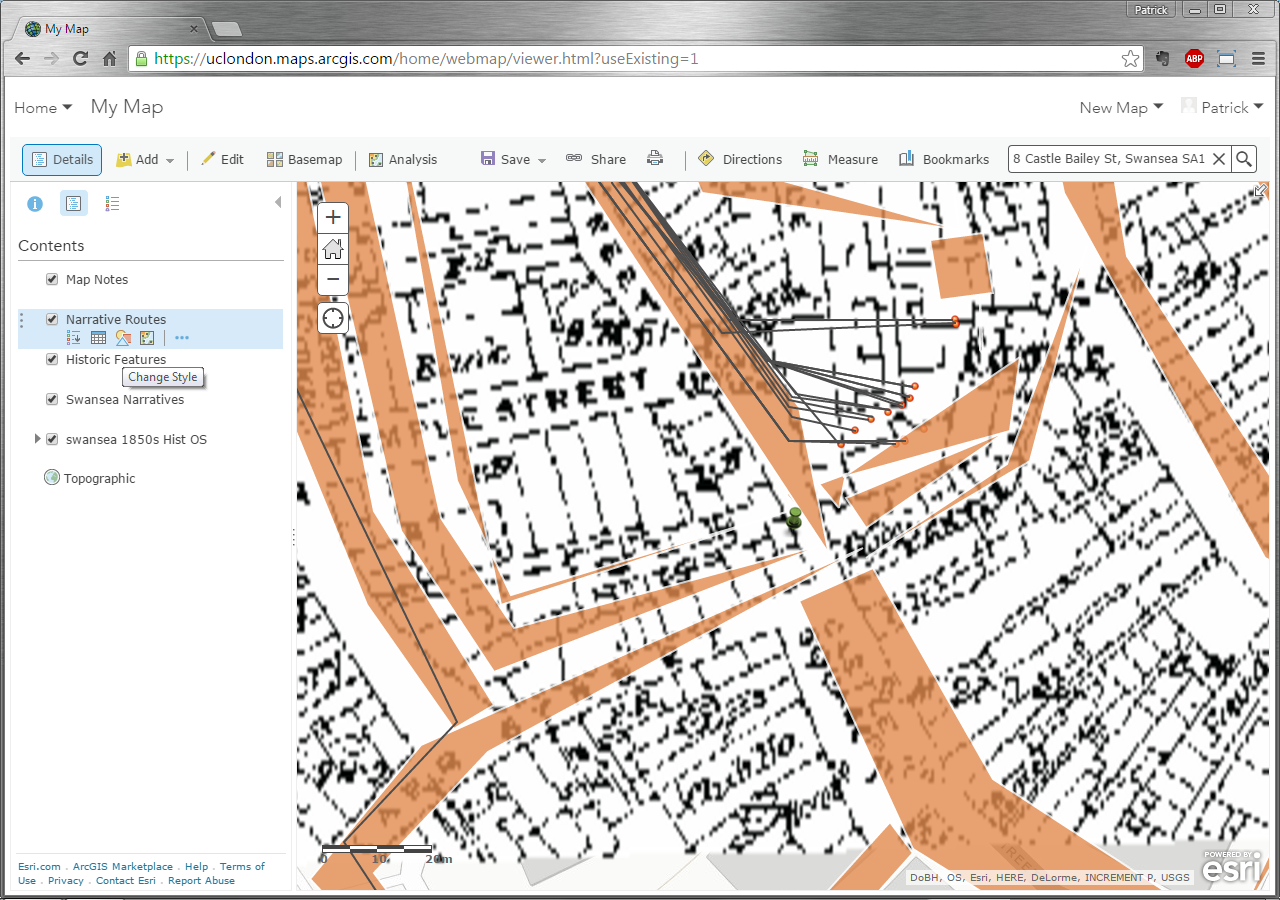
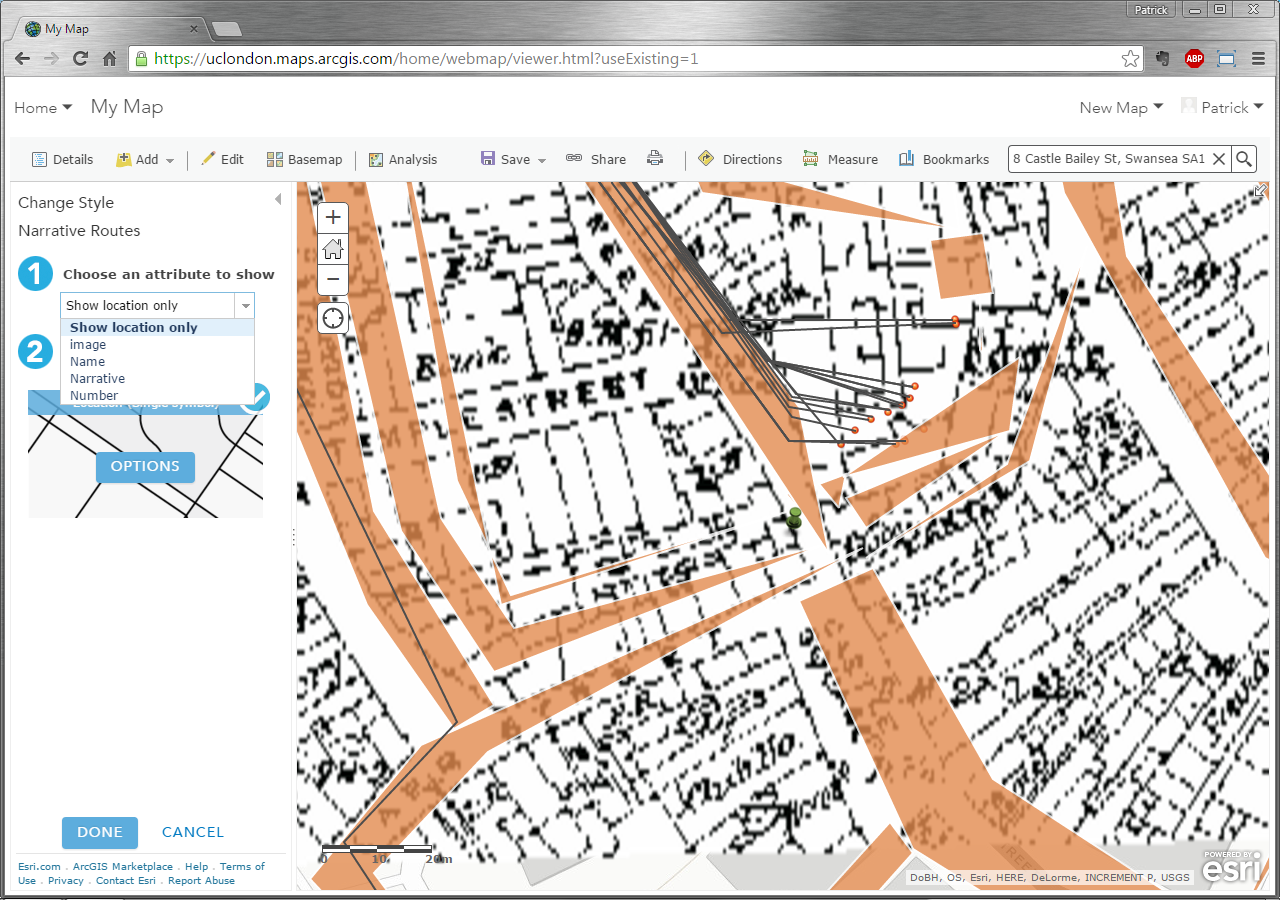
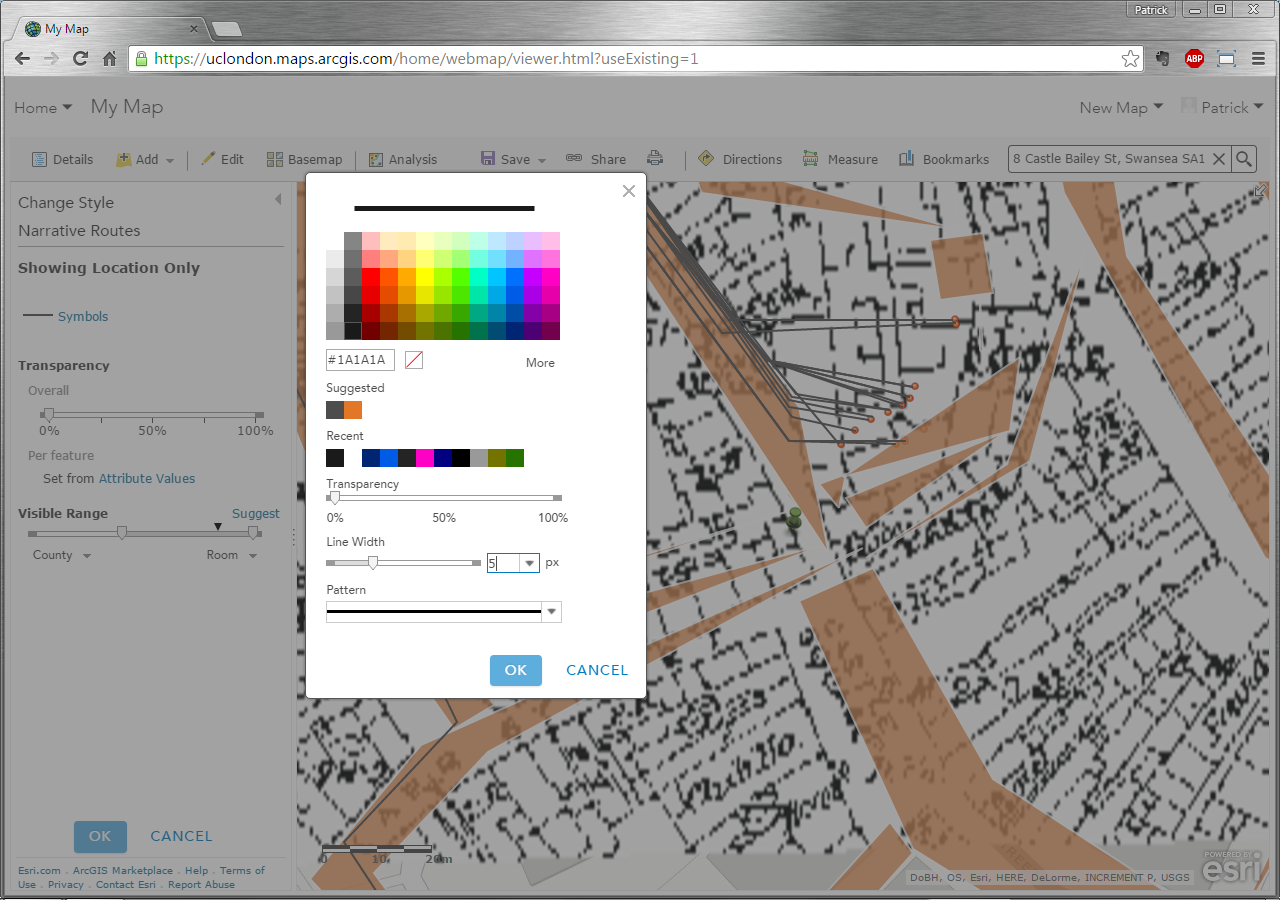
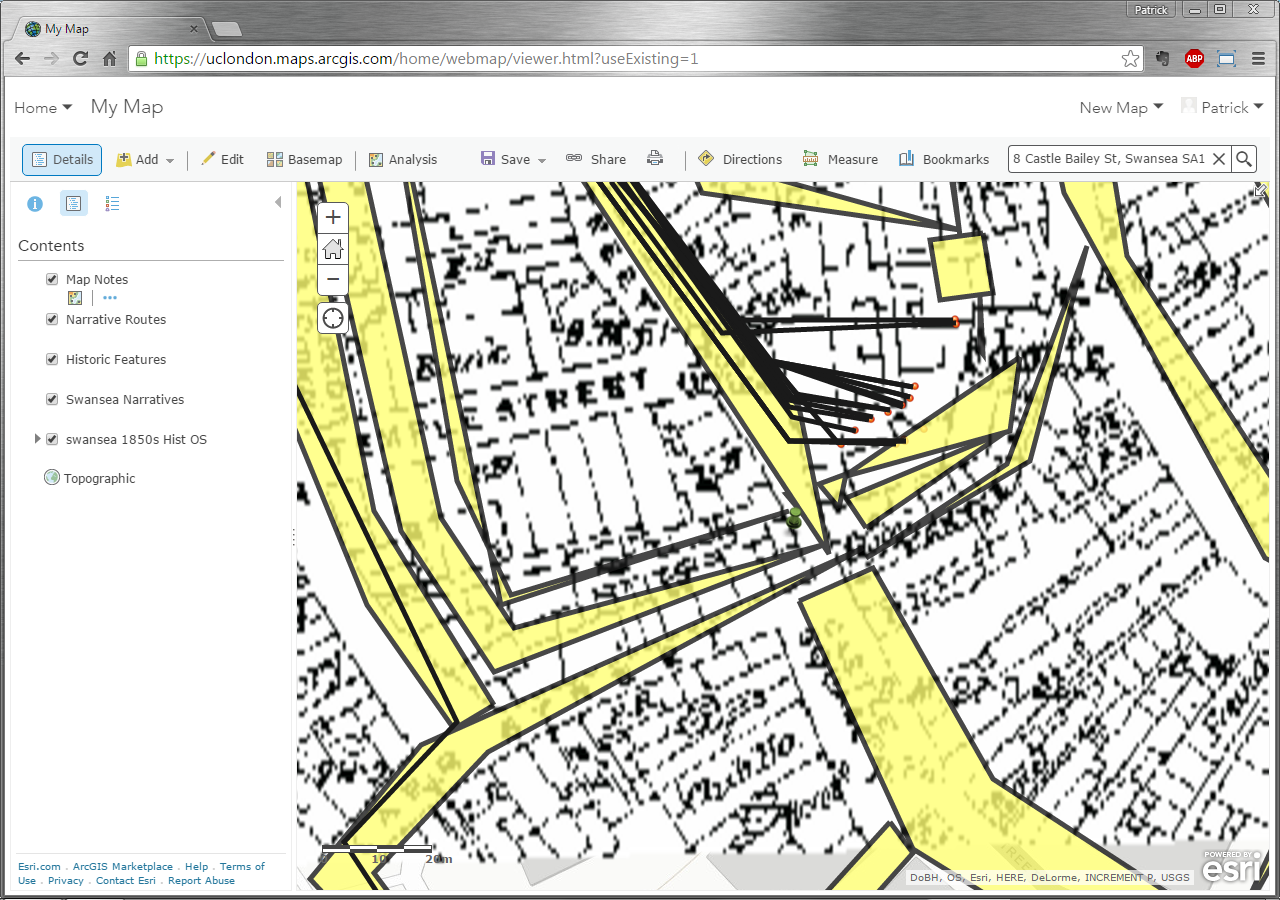
As you now have a number of layers, click on Show Map Legend (third icon from the left) in Contents in the panel to the left of the map to show the various symbols that represent features in the layers you’ve added to the map. Some of the features may be difficult to see on the map, as the default colours they may have been assigned may not be appropriate. Click on Show Contents of Map (second icon from the left) in Contents in the panel to the left of the map to show the various layers, and under narrative routes of medieval people (Narrative_Routes), select the Change Style icon. In Change Style, which is now in the panel to the left of the map, select “Show location only” under “Choose an attribute to show” and then click on the Options button under Select a drawing style. When the panel updates, click on Symbols (under Showing Location Only), which will pop up a new window. In this window, you will be able to select a new Color, Pattern, Transparency, and Line Width for the features of this layer; as this is a layer for narrative routes of medieval people, select a black Color by clicking on the coloured rectangle next to Color and selecting black from the colour options, keep the Pattern as a solid line, keep the Transparency at 0%, and change the Width to 5px (either by entering 5 into the box next to the slider or using the slider next to Width) and then click OK. At the bottom of Change Style in the panel to the left of the map, click OK and then click Done to complete the change to this layer. Repeat the same for historic features; however, you’ll notice the Change Style window is a bit different, as there’s a colour associated with the fill Color of the area, a Transparency for the fill area, an Outline color and the Outline width of the area. Again, click on the Color rectangle next to Color and select yellow from the colour options, set the Transparency at 25% and the Outline color as black, and change the Outline width to 5px, then click OK in the Symbols window and OK and then Done in Change Style in the panel to the left of the map.
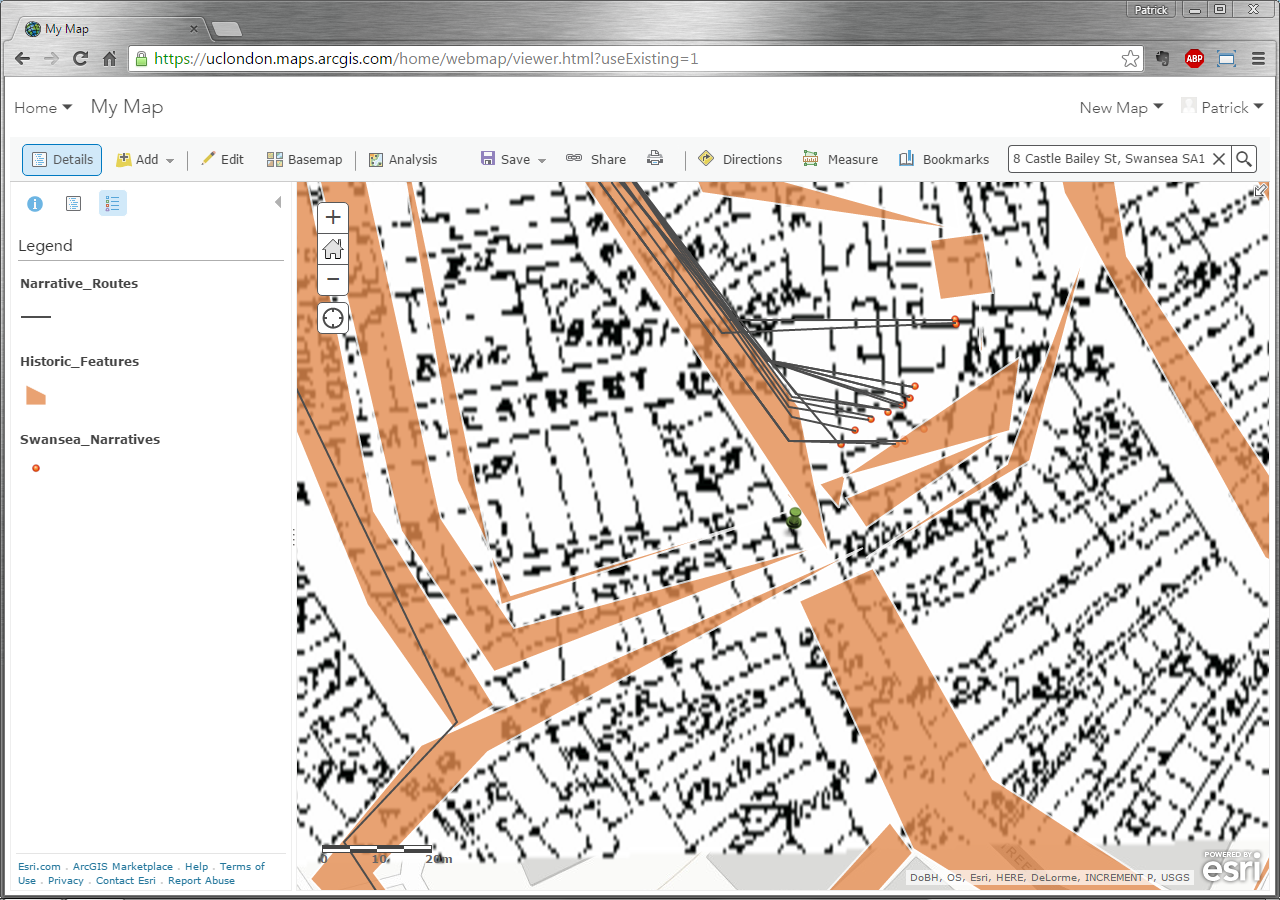
As you’ll be back in Contents in the panel to the left of the map, click on Show Map Legend (third icon from the left) to show the various symbols that represent the features in the layers of the map; you should see that the symbols for narrative routes of medieval people and historic features have now been updated with the new symbols that you chose (note: some layers may not be visible at your current scale so you may need to Zoom In or Out so they are visible in order to see any symbology changes made). Bear in mind that different colours have different meanings and some may be more appropriate for what you want to represent than others. Common colours and their connotations are as follows:
-Red: Hot, Danger, Stop
-Orange: Somewhat Hot, Arid Land, “Between Red and Yellow”
-Yellow: Sand, Sun, Urban Areas
-Green: Vegetation, Environmental Areas, Acceptable
-Blue: Cool, Water, Local Borders
-Purple: Cold, Major Roadways, Points of Interest
-Brown: Mountains, Heritage Sites, Military
-Black: Place Names, Roads, Railroads
-Grey: Minor Roadways, Municipal Areas, Inaccessible
-White: Snow, Indifferent, Background
Also be aware that these meanings can have different meanings in different cultures and may be difficult for those with visual impairments (e.g. colour blindness) to view.
Click on Show Contents of Map (second icon from the left) in the panel to the left of the map to go back to Contents.