Esri User Conference – Day 1

This morning kicked off the main event – the 2015 Esri User Conference! This part of the conference took over the entire San Diego Convention Center, with a total of over 16,000 people in attendance! Jack Dangermond kicked things off and shared with the crowd his vision, and the conference theme, of Applying Geography Everywhere. Indeed, Geography is a great integrator discipline and many problems have spatial complexities to them; I think given the growth of our industry and new economies that are emerging in the way of enhancing our experiences of the world around us, GIS is going to play an even bigger role in our world.

Check out Jack’s keynote and the rest of the videos from the Opening Plenary at GISCafe

We also had the opportunity to have a preview of the features and functionalities of new web capabilities of Esri Technologies and a first look at ArcGIS Pro – very exciting. A talk followed on the application of GIS to Wildfire Management, which is very important to saving lives and homes. The day’s plenaries closed out by Governor Martin O’Malley, discussing how GIS was used to reduce crime and manage city assets, when he was the mayor of Baltimore.

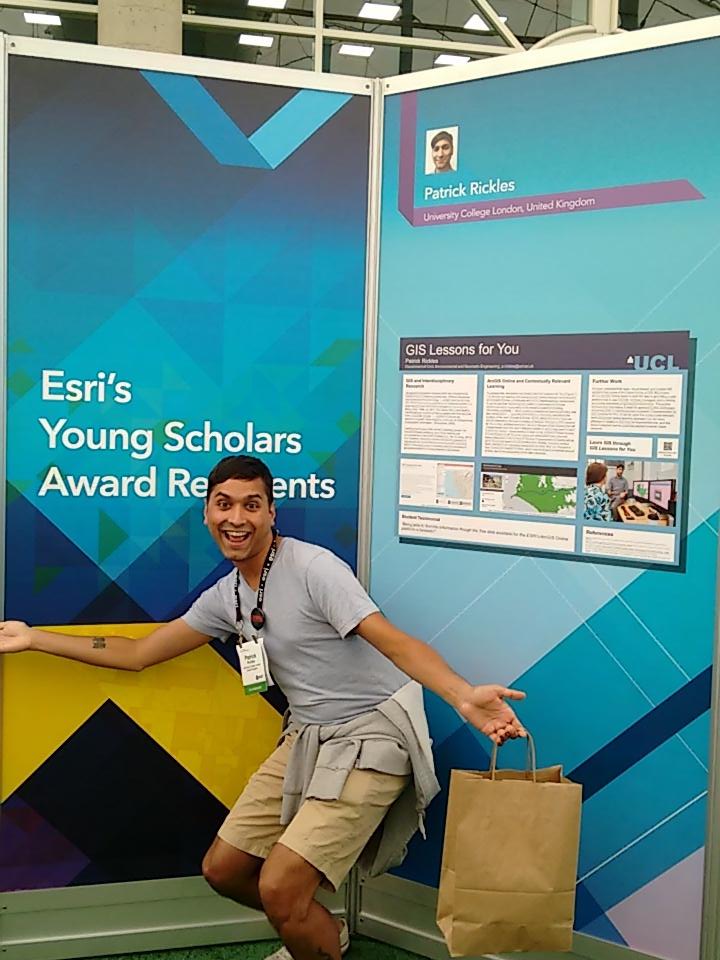
Afterwards, the other young scholars and I met at our posters in the Map Gallery to be there to answer any questions people may have. Of course, I had to take a cheesy photo with mine:

I still can’t thank Esri and Esri UK enough for the opportunity to attend; it was an absolutely brilliant event!

Esri Education User Conference – Day 2

The second day, I attended the Teaching and Learning with GIS session where I was pleased to see a colleague, Mary Fargher from UCL Institute of Education, who I had collaborated with on projects before, presenting on her work with teaching GIS as part of an Online Masters to her students around the world. The challenges that she raised resonated in the room, in that there’s often talk about the internet offering new opportunities for teaching, yet it also comes with issues such as asynchronous communication, tech and hardware issues, etc. Bob Kolvoord (James Madison University), also in this session started to outline a project his team is starting on where they’ll be pre/post testing K-12 students on spatial cognition and then teaching them GIS, which is very similar to the work I’m hoping to undertake as part of a proposed project where we hope to implement GIS in a cross-curricular fashion in 4 Secondary Schools around London; I’ll definitely be keeping an eye on Bob’s work.

The mid-morning plenary was on servant leadership in GIS, which brought on people like Diana Sinton (Cornell University [also part of SpatiaLABS, a great GIS teaching resource), Joseph Kerski (Esri), Tom Baker (Esri) and others discussing how GIS can be used in projects for and driven by community engagement – something we’re quite familiar with in ExCiteS. I think this is great for students, as well, because they get to see the real-world impact of their work, which can also increase student engagement.

I skipped out on lunch to attend the GIS Education Research Special Interest Group; at UCL, I’m the only one researching GIS education (that I’m aware of), so I was very much looking forward to the opportunity to meet with others doing the same. There were so many big names in the room (again, slightly star struck) and there was great conversation had on the challenges to the research we were undertaking and where we felt we could all improve to better support one another and the research community. I shared with the group (and was largely agreed with) that language is often a big challenge; we use jargon-y words or take for granted that some words we say have an implicit understanding in our community that may not make sense to those coming from outside of it – we need to be careful of that, otherwise we’ll alienate potentially interested people and scare them away.

For the afternoon session, I went to Lessons Learned with GIS in Schools, as I’m still trying to scope out ideas of the project with GIS in Secondary Schools. Michael Wagner (Loudoun County, VA) was actually talking about cross-curricular applications of ArcGIS Online in K-12; he largely focused on software management issues, but I definitely plan to follow up with him on the theoretical/practical applications of his study’s findings. I also especially enjoyed Shannon White (University of Missouri) and Barbaree Duke (GISetc) pairing the GIS professional and the teacher in the classroom to teach GIS, as well as Georgeanne Hribar (Virginia Beach City Public Schools) sharing her experiences of challenging students to think critically with maps.

After some amazing talks, I took the opportunity to unwind at the Esri Young Professional Network event happening that evening, to have drinks and meet with many people starting their careers in GIS. There are so many smart, wonderful people that I spoke with that are surely a sign that this industry will continue to grow and flourish and even greater things are to come. If you (or someone you know) is just starting into the world of GIS employment, do have them check it out.

Esri Education User Conference – Day 1

A month or so ago, I submitted a research poster to Esri UK to compete for the Jack Dangermond Young Scholars Award and the chance to represent the United Kingdom at the Esri Education User Conference and the Esri User Conference in San Diego, California. I was absolutely thrilled to find out that I’d won and would be going to the biggest gathering of experts from my industry. This also enabled me to confirm two presentations I was slated to give – one on my research on Teaching GIS to Interdisciplinary Researchers (with GIS Lessons for You) and another on the work Challenging RISK is doing.

The conference kicked off yesterday with, none other than, David DiBiase providing the opener. I have to admit that I was a bit star struck and nervous, as my work is critiquing the fine work him and his team did to establish the Geographic Information Science & Technology Body of Knowledge (it’s a great initiative, but I want to try and improve its suitability and application to interdisciplinary research initiatives that use GIS). The main speakers at the plenary were Ola Ahlqvist (Ohio State University [Go Buckeyes!] [as a native Ohioan, I have to give a shout out]) who discussed GIS Service-Learning (where community needs and classroom activities come together to create positive impact), Stacy Stark (University of Minnesota Duluth) who shared her experience with using GIS to engage Undergraduates, Stephanie Gibeau (one of Stacy’s graduates) who went on to quickly get employment in our industry, Robert Cheetham (Azavea) who promoted the good work of Benefit Corporations (B-Corps [which I think is the same our Social Enterprises in the UK]) using GIS to address community needs, and finally Madison Vorva who started the campaign to get palm oil that comes from unsustainable sources out of Girl Scout cookies and other products (eventually using maps to show who cares where, again, showing impact). All these stories were inspiring and really drove the message home that 1) our industry is in demand and 2) we can make amazing positive impacts on the world around us.

After the opening and lunch was the session I was scheduled to talk in (Frontiers of GIS Education), which I was a bit nervous for, as 1) I’d be giving a lightning talk (short and fast paced [never done one before]) and 2) also in my session speaking was Karen Kemp (University of Southern California) who is someone whose work I’ve quoted quite a bit and would be listening what I had to say. My talk felt like a blur (thankfully I stuck to time and hopefully I was able to get my research across) and at the end, none other than Karen actually asked me a question (or rather gave me a helpful comment on a GIS concept I should look into further). If you’d like to check out my presentation, it’s online here. The other speakers discussed great stuff: Patrick Kennelly (LIU Post) on the journal – Cartographic Perspectives, Bill Hamm (University of Waterloo) on his findings on the multidisciplinary background of his students, David Webb (VWCC) on what you can do (as well as the troubles of) using UAVs for imagery creation, David Goldberg (Texas A&M) who data mined LinkedIn to understand what skills employers were looking for from GIS grads (30% want Python), Karen Kemp on the potentials of CyberGIS (big data, big compute) and a complimentary Education compendium that allows you to search for materials based on various factors (level, Bloom’s Taxonomy, etc. [fascinating!]), and Paul Hunt (University of Nebraska Omaha) on using web based map quizzes to assess geographic understanding.

For the afternoon session, I sat in on GIS and Science Education (to get some ideas for the project proposal with the Institute of Education [mentioned in the previous post]) and very much enjoyed the presentation by Kristin Bott (Reed College) who presented on her interdisciplinary education work with undergraduates assessing thermal efficiency of houses in Portland, Oregon.

The evening marked the first of a number of social events scheduled for the various winners of the Young Scholar’s Award from around the world. We had the chance to meet and greet each other and then check out the expo of GIS professionals being held. Everyone’s done such amazing work that I’m honoured to be able to be considered amongst them and am looking forward to further events with them and during the rest of the conference.

Institute of Education and GIS in Secondary Schools

About 1.5 years ago, the head of my research unit (Prof. Muki Haklay) was contacted by researchers from the Institute of Education (IOE) in regards to his interest in a possible project about using GIS in Secondary Schools and offering workshops to teachers as continued professional development. As this work was very much in my research sphere of interest, Muki decided to bring me on board. After initial talks and preliminary workshops with teachers, using the tiny seed-corn money Muki and the researchers were able to procure (roughly £2000), we wanted to keep working together and see if we could spin this into something bigger. We applied for further budget from the Stategic IOE/UCL Partnership Fund (which was produced to encourage researchers from both institutes to work together, as IOE was merging with UCL in the near future) and was delighted when we received a further £8000 to further expand the applications of teaching in a cross curricular fashion (to encompass not only STEM subjects [Science, Technology, Engineering, and Mathematics], but to further expand to the Arts and Humanities); our idea is simple – GIS transcends the disciplines and can be a useful tool to all teachers, across subjects.

With renewed vigour, we ran an exercise with one of the teachers’ classes, using EpiCollect+ (an open source data collection platform app) to map water quality, various types of plants, and pollution in the area – telling a holistic story of the health of the Roding River. Unfortunately, tech was not on our side that day – there was confusion with the app, the phones failed, and ultimately the students simply had to do the exercise by hand (using pen and paper). As my area of expertise largely centres around GIS tech, I was disappointed to here how the initial classroom exercise went and apologised to the teacher for the inconvenience.

“If at first you don’t succeed, try, try again” (as the old addage goes). Another one of our study’s teachers reached out and wanted to do a classroom exercise, and this time I was going to be sure that I was ready – I ordered brand new phones, I configured them myself and this time, I was going to make sure I was there for the exercise (should there be any issues). Instead of water quality, these students were mapping out quadrats (10 x 10 square grids) to measure biodiversity of plant life in a field. Originally, this exercise entailed the use of measuring tap, and pen and paper to record plants and percentages; with EpiCollect+, the students would randomly lay down the quadrat, take a picture with the phone, record the findings, and quickly move on. The key to using EpiCollect+ and smartphones is to utilise the built in GPS of the phone to obtain the location.

The second exercise was a success and, after a bit of post processing, I created an ArcGIS Online Story Map of the students’ output – feel free to take a look here. Though excited by the success of the second exercise, it does make me think about how teachers would be able to implement this technology, and handle any troubles that may arise, without the intervention of an expert in the technology, to circumnavigate any gremlins that may be lurking in the program to muck things up.

Anyway, we’re continuing to move ahead with the work with the teachers and will be submitting a proposal for continued work very soon to the research councils; if we’re successful, we’ll be partnering with these schools for 3 years to develop a framework of how we may implement GIS in secondary schools to be used as a cross-curricular tool to aid and enrich learning. Fingers crossed, and watch this space for further developments. 🙂

Teaching Through Research Workshop – Day 10

Unfortunately, I had to leave the workshop midway through Day 9, as I had to catch my Eurostar back to London, but I’ve used this day, and I’m sure I will use many more, to reflect upon everything that’s happened.

  • Paris was lovely, the CRI is a great institute bringing brilliant people together, the food was lovely, and the conference attendees were genuinely nice people that I hope to maybe see again in the future.
  • Though many people were from Bio, Chem, and Physics, which to me are fairly similar disciplines, in comparison to the variety of disciplines I work with, they view each other as very different (and my own discipline was completely off the map [no pun intended]); with that said, they talked about the interdisciplinary understandings they’ve established, and I don’t feel like they largely got mine. This has made me think that there is a “small scale” interdisciplinarity and “large scale” interdisciplinarity. Though Mathematicians and Psychologists may have a wider gap between their disciplines (“large scale” interdisciplinarity), that doesn’t mean a gap doesn’t exist between Biology and Chemistry (“small scale” interdisciplinarity”), even though an intermediate sub-discipline exists (Biochemistry).
  • Again, I’m not sure if people really got my discipline (or cared to do so), but I think I was able to reach and interest some. Perhaps we can think of interdisciplinarity in another way – as its own sphere of knowledge and its boundaries are the limits of the interest of the interdisciplinary researcher. An interdisciplinary Biology/Chemistry person may zone out during a talk from an Artist/Psychologist as, though both bits of work are interdisciplinary, it’s not in their area of interest and they don’t see how it can connect with potentials for the them – but it’s not to say one is more important than the other (just different audiences). This, however, may mean missing out on possible new opportunities or connections.
  • It was great to see so many people passionate about teaching and their discipline; from that energy, I took away a new found meaning of purpose in my own and what I’m doing. We tend to think about only one academic path – the one where you publish a bunch of papers, pull in research grants, and obtain the hallowed “Professor” title; however, there is another path – where you work with interesting people on interesting projects that may be able to change the world, at least in some small way.

Teaching Through Research Workshop – Day 9

(The moment of truth… It’s all come down to this…)

After 9 days of working on the programme I wanted to deliver, to teach GIS to those coming from different disciplines who may want to use it in interdisciplinary research, it was time to present what I’d pulled together. Well, I can’t say that it went terribly well, but that was mostly my fault for spending too much time on the background and not enough time on the actually activity itself. In the end, I was cut off probably 2/3 the way through and didn’t get to the most important parts that I wanted to get from the group, which were the elements I felt like I needed further guidance one.

The presentation can be found on Slideshare, should anyone be interested in reviewing it. Perhaps the things I pulled together would’ve been best saved to discuss with my PhD supervisor anyway…

Teaching Through Research Workshop – Day 8

The day started off with some interesting talks on “glocal” (think global, act local), critically understanding materials, that the unexpected in teaching is okay, and the importance in empathy in teaching.

At lunch time, we were given time to work on the final presentations for our projects we’ve been working on at the workshop; however, before cracking into that, I took a bit of time to find out about Repgrid, as one of the workshop participants was familiar with the associated techniques. Not having any familiarity with this, from what I was able to understand, this technique requires selecting at least 12 elements associated with a question, finding the similarity/differences between specific elements to create 4 context dimensions, and then rating each element from 1 to 5 based on the negative/positive aspect of the context dimension. For this exercise, we were told to think of 12 elements that make a good teacher. Afterwards, we were asked to look at 3 specific elements, 10 times, to find which of the 3 was different and why (e.g. look at elements 7, 9 and 12, and pick which one’s different from the other two and why, then repeat for the next 3 specified elements given to us). My elements were as follows: Expertise in the Discipline, Impress Relevance, Foster Critical Thinking, Continued Professional Development, Knowledge of (Teaching) Tools, Expertise in Teaching Theory, Ability to Adapt, Engage Students, Performance, Patience, Create Safe Environment, Humour. The contexts we identified from those elements were Teaching Strategy, Student Needs, Personality, and Content. After then rating each of those elements from 1 to 5 and pressing the button, the image at the top of the post was the output.

Interestingly, what we found, not only through mine, was that Expertise in the Discipline, though thought to be important, was quite low in priority than elements associated with the teacher’s personal traits (Humour, Patience, etc.). What this said for me, at least, was that I liked a teacher with personality who was able to engage with me personally, rather than an “expert”.

It was a brilliant exercise, but I did have to get on with my work, so I left for the apartment I was renting, relocated with the laptop to the balcony, and wine in hand finished off the presentation.

Santé